US Amateur Licenses
Based on data from AHØA.org

|
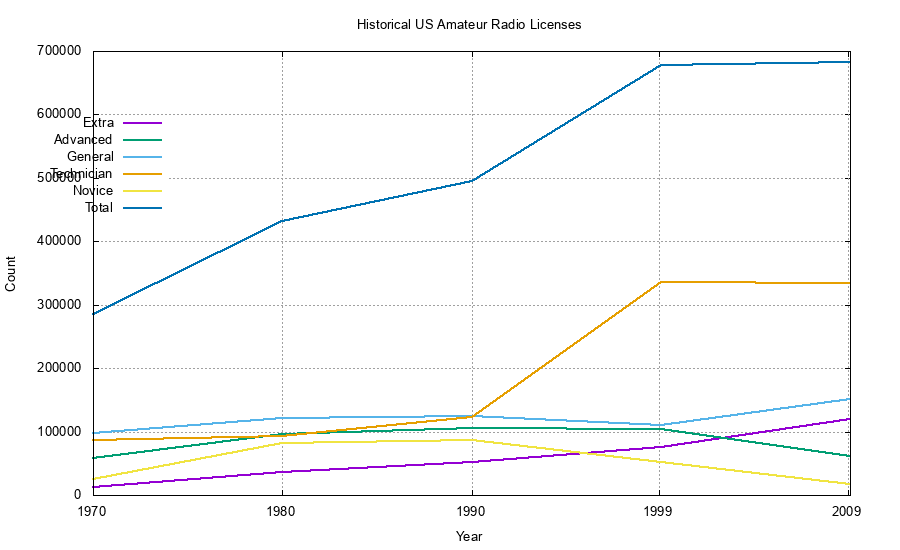
Above are decadal license counts for the past forty years.
Data for 1970, 1980 and 1990 are from QST Jan 2011 page 99.
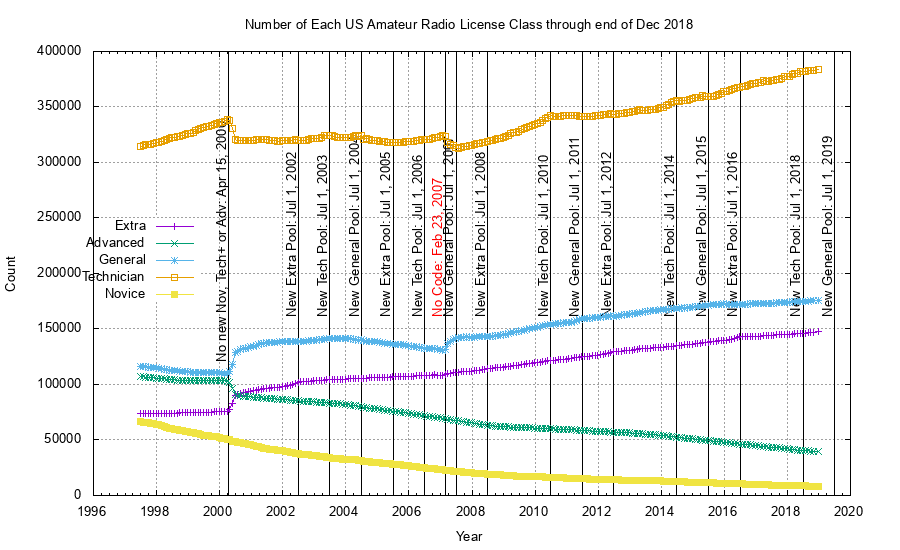
How does this increase compare to the US population as a whole? The table below shows the US populataion, the total ham population and their changes per year. Before 2000 the total amateur population grew at rates well above the population as a whole. Over the next decade total ham growth slowed only to increase again in the past few years. |
| Year | US Pop Millions | % Increase per year | All Hams Thousands | % Increase per year | % US Pop | |||
|---|---|---|---|---|---|---|---|---|
| 1970 | 203 | 285 | 0.140 | |||||
| 1980 | 225 | 1.08 | 433 | 5.19 | 0.192 | |||
| 1990 | 249 | 1.07 | 494 | 1.41 | 0.198 | |||
| 2000 | 279 | 1.20 | 677 | 3.70 | 0.243 | |||
| 2010 | 308 | 1.04 | 682 | 0.07 | 0.221 | |||
| 2015 | 320 | 0.78 | 725 | 1.26 | 0.227 | |||
| 2019 | 327 | 0.55 | 755 | 1.03 | 0.231 |